The Chester figures, month by month
We ran the European Commission’s PVGIS solar model for central Chester, using its PVGIS-SARAH3 irradiation data for 2005-2023 and allowing 14% for system losses. On the best roof in the city, facing south at 40°, one kilowatt-peak of panels makes about 961.6 kWh a year. A kilowatt-peak, or kWp, is the panels’ rated output under standard test conditions; system sizes in quotes are given in kWp.
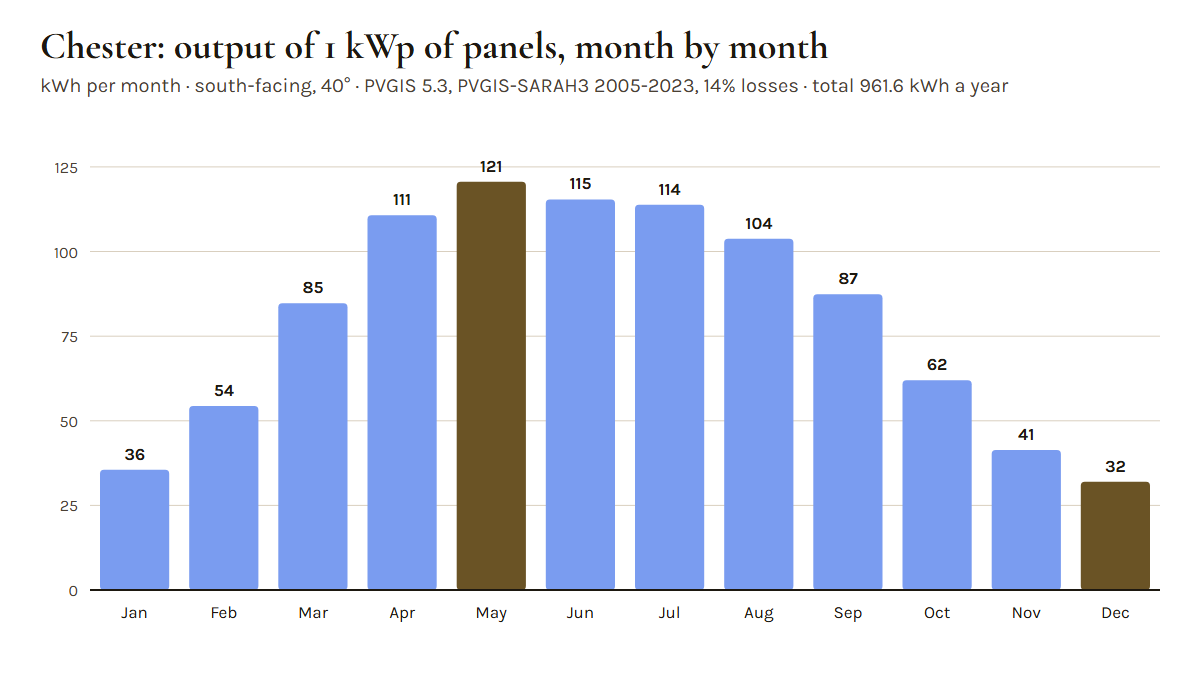
Here is how that year divides up:
| Month | kWh per kWp | 4 kWp system, kWh | Share of the year |
|---|---|---|---|
| Jan | 35.5 | 142 | 3.7% |
| Feb | 54.4 | 218 | 5.7% |
| Mar | 84.7 | 339 | 8.8% |
| Apr | 110.7 | 443 | 11.5% |
| May | 120.6 | 482 | 12.5% |
| Jun | 115.4 | 462 | 12.0% |
| Jul | 113.8 | 455 | 11.8% |
| Aug | 103.8 | 415 | 10.8% |
| Sep | 87.4 | 350 | 9.1% |
| Oct | 62.0 | 248 | 6.4% |
| Nov | 41.4 | 166 | 4.3% |
| Dec | 32.0 | 128 | 3.3% |
Winter against summer, in shares
Put the three darkest months together and the gap is plain. November, December and January make 108.9 kWh per kWp between them, about 11.3% of the year. May, June and July make 349.8 kWh, about 36.4%, which is 3.2 times as much. Split the year in half and October to March produce 32.2% of the total, April to September 67.8%.
December on its own makes about 27% of what May makes. Spread across the days, the best Chester roof averages about 1.0 kWh per kWp a day in December and about 3.9 in May. For a 4 kWp array that is roughly 4.1 kWh on an average December day against about 15.6 on an average May day. Individual days vary widely around those averages, depending on cloud.
The dip is short, and the recovery is quick. October still makes about 1.9 times December’s figure. By February output is back to about 54 kWh per kWp, and March alone, at about 85, makes more than December and January together (67.5). The truly lean stretch is the few weeks either side of the shortest day, roughly November to January.
Why output falls so far
A low sun
In midwinter the sun stays low over Chester even at midday. Its light passes through more of the atmosphere before it reaches the roof, so less of it arrives, and any obstruction to the south throws a long shadow.
Short days
There are simply fewer hours of daylight to work with in December than in June. The panels have a short working window each day, and the sun is low for all of it.
Cloud and diffuse light
Panels do not need direct sunshine. They also generate from diffuse light: light scattered by cloud and the atmosphere, which reaches them from the whole sky rather than straight from the sun. That is why output on a grey day is low but not zero. On an overcast day most of what the panels receive is diffuse, and diffuse light carries less energy than direct sun.
Cold is not the problem
A common belief is that panels struggle in the cold. They do not. Panels lose a little efficiency as they get hot, not as they cool down, so a cold, bright day is good working weather. Snow is different: while it covers the panels, little light gets through. Do not climb onto a roof or use tools on the panels to clear it.
Shading is worse in winter
A low sun means long shadows. A chimney stack, a neighbour’s gable, a taller building across the street or a tree that clears your panels completely in June can shade them for much of a December day. That matters on the Victorian terraces of Hoole and Boughton, where chimney stacks sit along the ridge line, and anywhere a roof faces a taller building or a mature tree.
Evergreen trees shade all year; trees that lose their leaves let more light through in winter, but their branches still cast some shadow. The PVGIS figures on this page allow for the horizon formed by the surrounding terrain, not for buildings or trees, so they describe an unshaded roof. Ask any installer how shading on your roof was assessed for their MCS performance estimate, and whether winter shadows were considered, not just the summer view.
Roof direction and pitch matter more in winter
Over a whole year, a roof that does not face south loses less than people expect. In winter the gap widens sharply. At a 35° pitch, an east- or west-facing roof makes about 79% of a south roof’s annual output but only about 41% of its December output. A north-facing roof makes about 54% of the south figure over the year and about 21% in December.
| Roof faces | December | June | Year | December, vs south | Year, vs south |
|---|---|---|---|---|---|
| South | 30 | 118 | 959 | 100% | 100% |
| South-east | 24 | 117 | 901 | 81% | 94% |
| South-west | 24 | 118 | 903 | 80% | 94% |
| East | 12 | 110 | 757 | 41% | 79% |
| West | 12 | 111 | 760 | 40% | 79% |
| North | 6 | 95 | 518 | 21% | 54% |
Pitch works the same way. A steeper roof faces the low winter sun more squarely, while a shallow one catches more of the high summer sun. Facing south, a 50° roof makes about 52% more than a 20° roof in December, but only about 4% more over the year.
| Pitch | December | June | Year |
|---|---|---|---|
| 20° | 23 | 122 | 919 |
| 30° | 28 | 120 | 951 |
| 35° | 30 | 118 | 959 |
| 40° | 32 | 116 | 962 |
| 45° | 34 | 113 | 959 |
| 50° | 35 | 109 | 951 |
Our Chester roof output estimator uses the same PVGIS runs, so you can try your own direction, pitch and system size and see the month-by-month bars.
Is my system working? Reading your winter figures
It is easy to open a monitoring app in November and wonder whether something has gone wrong. Usually nothing has. To check, multiply the monthly figure in the first table by the size of your system in kWp, then allow for your roof: an east or west roof makes well under half the south figure in December, and shading from chimneys or trees can take more off. If your total for the month lands in that region, the system is behaving as the model expects.
Two patterns are worth raising with your installer: output that drops to nothing on a bright, clear day with no snow on the panels, and a whole year that falls well short of the MCS estimate in your quote. A single grey month is neither. Keep a note of monthly totals from the start, because a year of your own figures is better evidence than any model.
What this means when you are deciding
- Judge solar on the year, not on December. The months that decide the case are April to September, which produce about two-thirds of the total on the best roof.
- Expect winter bills to stay high. Demand for light and heat peaks just when output is lowest. Homes heated by electricity alone feel this most; our guide to Chester homes by ward shows where those homes are.
- A battery has less to store in winter. When the panels make little, the house tends to use it all as it arrives. Our battery guide explains when one helps.
- Exports are a summer story. Most surplus power goes to the grid between spring and early autumn, so an export tariff earns most in those months.
- Ask for a monthly estimate. An installer’s MCS estimate for your roof is the figure to plan around. Our guide to choosing an installer sets out what a sound quote should contain.
About these figures
The figures come from PVGIS 5.3, run on 3 November 2026 for 53.1905° N, 2.8919° W in central Chester, with crystalline silicon panels, PVGIS’s mounting setting for panels with air able to circulate behind them, 14% system losses, the PVGIS-SARAH3 satellite-based irradiation database for 2005-2023, and the horizon taken from surrounding terrain. They are long-run averages: any single winter can be duller or brighter. They are estimates, not measurements, and real output depends on shading, orientation, pitch and equipment.